
AI-Powered Product Cost Intelligence for Better Pricing Control
A global healthcare leader and Applexus team up to build an AI-powered cost comparison agent and emerge as winners at SAP’s 2026 Hackathon
Cost movements are rarely explained by a single number.
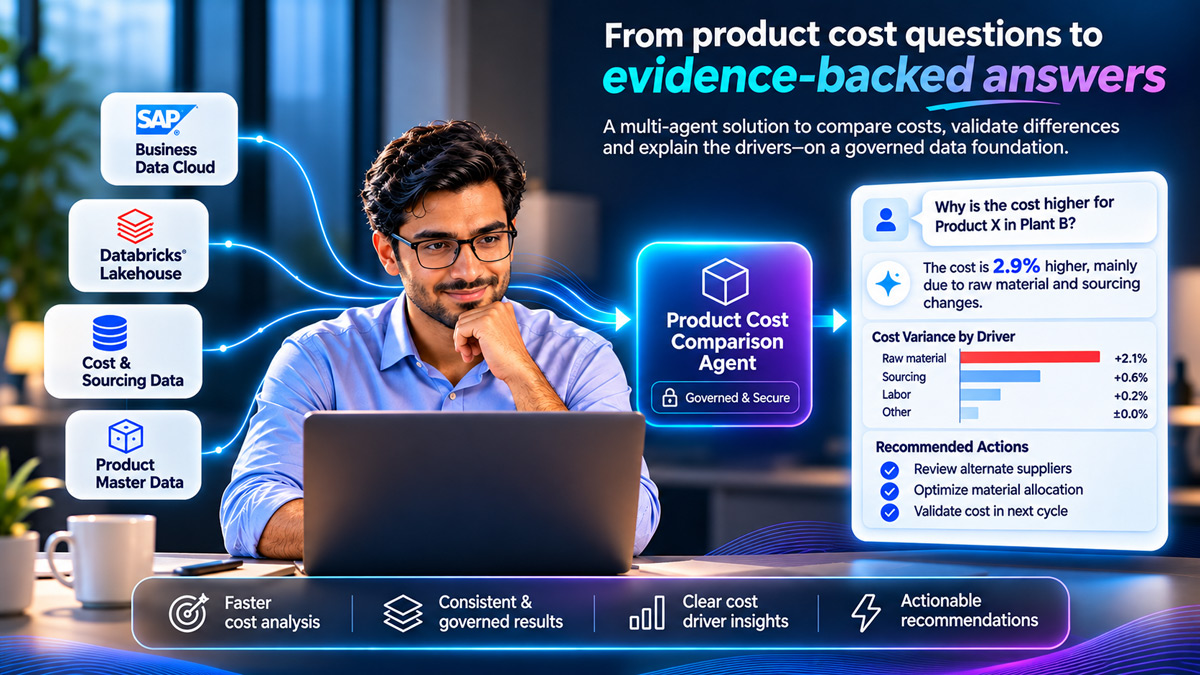
A global healthcare enterprise needed a clearer way to compare product-cost snapshots, identify what had changed and explain the drivers behind cost movements. The process involved reviewing large volumes of product-level data, cost components and underlying cost trees. At SAP’s 2026 Americas Business AI Platform Hackathon, Applexus worked with the customer team to demonstrate a Product Cost Comparison Agent that brings structured analysis, evidence and AI-assisted explanations into one reviewable workflow.
 Enlarge
Complex cost movements. Manual analysis. Limited visibility.
Comparing costing versions and explaining product-level changes required detailed investigation across large datasets and individual cost components. The process made it difficult to consistently identify the reasons behind movements and distinguish genuine cost changes from potential data issues.
- Time-intensive comparisons. Large costing snapshots required extensive manual analysis.
- Complex cost drivers. Explaining movements meant tracing individual cost components and underlying cost trees.
- Inconsistent commentary. Variance explanations could differ depending on who performed the analysis.
- Data-quality uncertainty. Quantity basis, plant information and currency-rate issues needed investigation before reporting.
One comparison engine. Two workflows. Evidence behind every explanation.
Applexus developed a Product Cost Comparison Agent to automate structured comparisons and prepare evidence-backed explanations for business review. The prototype supports two distinct scenarios through a common analytical framework.
Two Workflows
- Version-to-version: Compares a newly loaded costing version with its preceding version in the same period, identifying changes, exceptions and potential data issues.
- Final-to-final: Compares approved final costing versions across periods to explain product-cost movements for management reporting.
Core Capabilities
- Analyses movements across foreign exchange, price, quantity, sourcing and cost structure.
- Identifies product-level exceptions and potential data-quality issues.
- Provides supporting records and suggested checks for investigation.
- Prepares commentary with confidence levels, caveats and review status.
- Keeps unexplained differences visible rather than assigning unsupported causes.
A governed data foundation with AI-assisted analysis and human review.
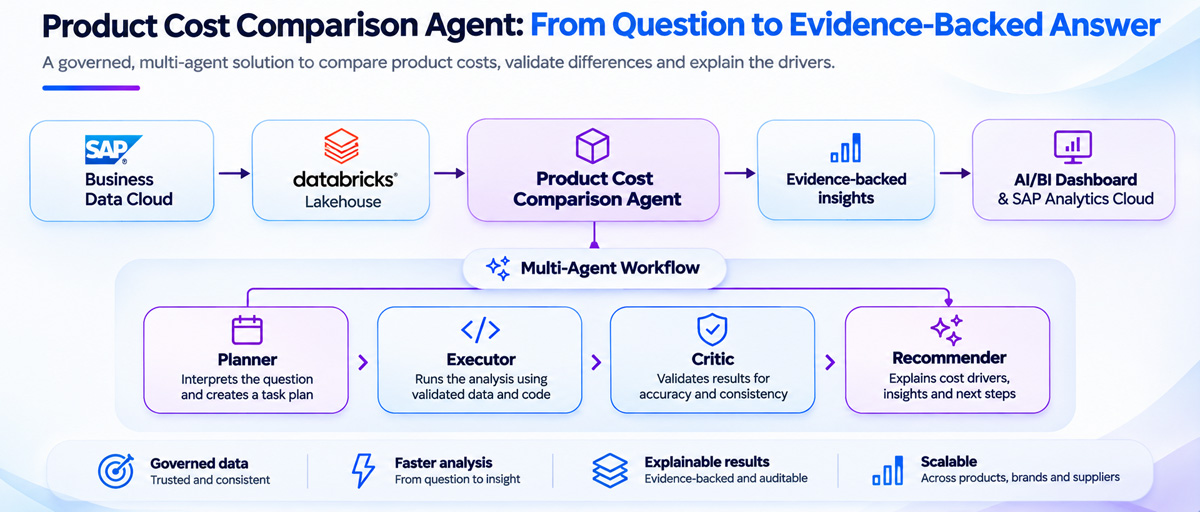
SAP Business Data Cloud provides the costing data. Databricks Lakehouse supports data processing, comparisons and analytical results. Model calls are managed through Unity AI Gateway, while four agent roles coordinate planning, execution, critique and recommendations. Structured outputs support the AI/BI dashboard and SAP Analytics Cloud.
 Enlarge
Technology Components
- SAP Business Data Cloud - provides the product-cost data.
- Databricks Lakehouse - processes comparisons and analytical results.
- Unity AI Gateway - manages model calls.
- Agentic architecture - Planner, Executor, Critic and Recommender roles.
- AI/BI dashboard - six views for overview, exceptions, drivers, sourcing, quality and snapshots.
- SAP Analytics Cloud - receives structured output tables for reporting.
Accuracy and Governance Note
Financial calculations are performed through code. AI supports the interpretation and explanation of verified results. Commentary is reviewed by business users before it is used for reporting.
An exploratory comparison surfaced cost movements and data-quality signals.
A hackathon exploration comparing two fiscal periods demonstrated how the agent can bring the overall movement and its underlying drivers into one view.
Proof Points
- The total basket increased by 2.9%, while the like-for-like basket of common products decreased by 1.65%.
- The analysis identified 770 SKUs with a change in supplying plant, highlighting sourcing shifts as an important factor.
- Potential data-quality issues involving quantity basis, plant codes and currency rates were surfaced for investigation.
More complete comparisons. Clearer explanations. Evidence users can review.
- Broader product-level coverage across costing comparisons.
- Less repetitive manual investigation.
- More consistent variance explanations.
- Better visibility into potential data-quality issues.
- Traceable commentary supported by underlying costing records.
- Business-reviewed outputs for reporting.
What’s Next
Potential extensions include year-over-year, legal standard-cost, brand and supplier analysis, alongside natural-language-to-SQL capabilities. These depend on additional customer data and agreed business definitions.