Intelligent Customer Analytics – The Future is Here!
14 September 2020


Sanjana Nair
Senior AI ConsultantSanjana Nair is an AI Consultant at Applexus. She has 9+ years of experience in the IT industry, centred around the development of AI/ML solutions for...
Customer Analytics is key to the success of any business organization. There is much to be gained from understanding customer behavior and preferences, especially in today’s day and age, where every consumer has access to all the information they could want for at their fingertips; products, prices, where to go, what to buy…and so on. The better we are able to understand the customer, the more accurately we will be able to predict their behavior and preferences, making it possible to tailor our marketing strategy to cater to them.
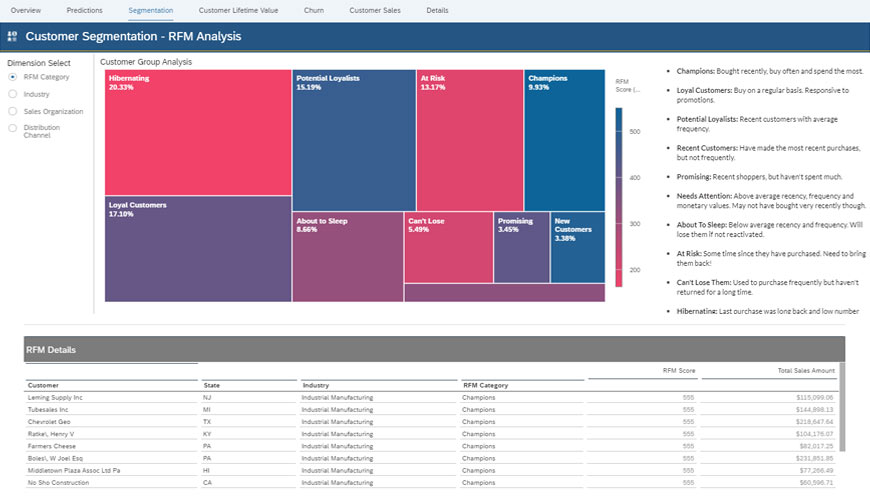
One of the most common approaches to understand the customer base is Segmentation. It involves statistical analysis of historical customer data. Analysing and categorising customers can help drive important business decisions. One such approach is RFM segmentation, where customers are grouped into categories based on their Recency of purchase, Frequency of purchase and net Monetary value of purchase over a specific timeframe. Categorising customers in this manner helps understand the most loyal (‘Champion’ category) customers, or for instance, those at risk of leaving (‘At-risk category) and can aid in targeted marketing strategies.
The picture below depicts an RFM dashboard. As you can see, segmentation makes it easy to understand how the customer base is split up. For instance, here, roughly 9% of the customers are ‘about to sleep’ and may require specific marketing strategies to be retained.
While the Segmentation approach was purely ‘Descriptive’, using only historical data, Customer Analytics also includes predictive approaches, where historical customer data is fed into Machine learning models to predict the future.
SAP HANA provides the framework for in-database Machine learning through two channels – the APL (Automated Predictive Library), targeted at business users and the PAL (Predictive Analysis Library), intended for use by data scientists. More details about the PAL library and available functions can be viewed here.

Data from various sources (SAP/Non-SAP) can be imported into HANA, where the data is fed into PAL algorithms. The results from the machine learning model can be exported to HANA tables, which in turn can be used to generate graphical reports in the SAC (SAP Analytics Cloud). The entire process occurs in-database, making it extremely fast.
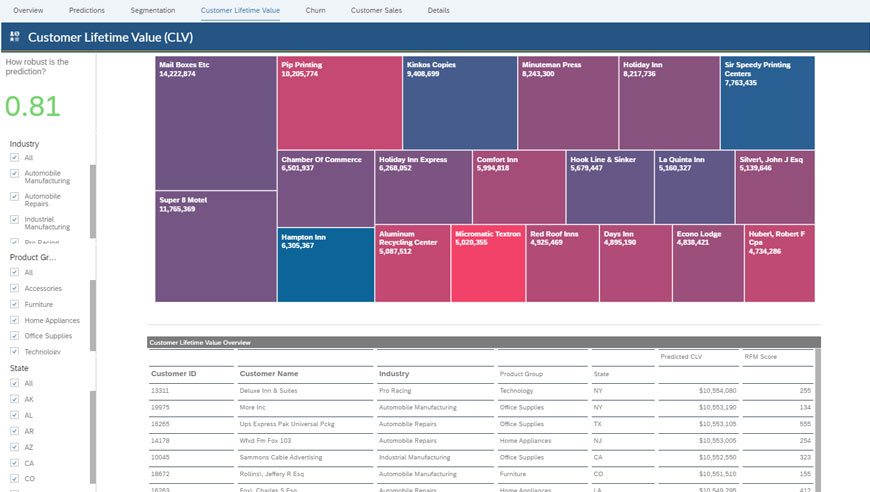
One of the key Customer metrics that every business keeps an eye on is the Customer Lifetime Value (CLV). CLV is the net predicted value a customer is expected to spend. Here, historical customer data is modelled to predict the future value of the customers transactions, making it part of the ‘Predictive Customer Analytics’ approach. It helps identify who the most valuable customers for a business are and aids targeted marketing strategies. The snapshot below depicts a Customer CLV dashboard.
A common problem that every business is affected by is Customer churn. Why do some customers stay on as loyal customers, while other customers leave? What factors contribute toward a customer churning? It is important to note that the cost of acquiring new customers is much more than that required for retaining the existing customer base, making these questions highly relevant from a financial standpoint.
Understanding what causes a customer to churn is crucial; Businesses with a high churn rate are not only failing to meet the expectations of the current customers, they are also negatively impacting the possibility of future customer acquisitions and business growth. Churn, however small, is not a problem that can be overlooked. It is a dynamic problem that need to be actively analysed and treated.
Customer churn prediction can be tackled using Machine learning. One of the common ways to do this is by framing it as a binary classification problem. This is a Supervised machine learning method, where we require labelled input data. Commonly used algorithms for this type of problem are Decision Trees, Random Forests, Logistic Regression etc. These algorithms are easy to interpret and scale well to large datasets. On the other hand, algorithms such as Neural networks and SVM’s are better suited when there are a large number of input features. However, these algorithms are computationally more expensive and less interpretable. The algorithm that is chosen will depends on a combination of all these factors and will vary from one use-case to another. Also, multiple algorithms may be tested on the available data to identify the one with best performance.
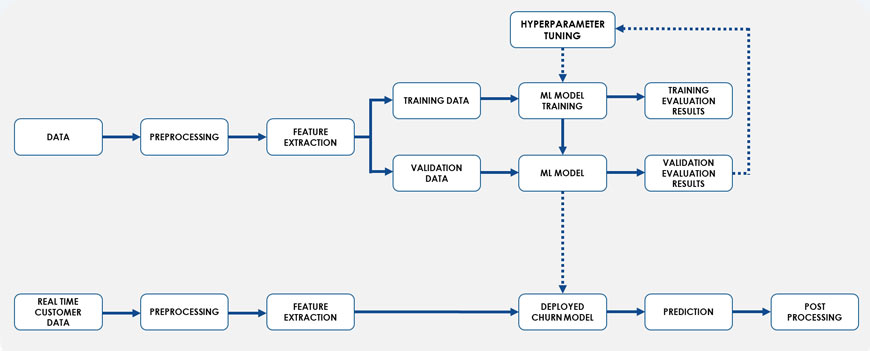
The picture above depicts a general Machine learning workflow. The first and most important step in this process is data acquisition. Getting the right data, getting good quality data and getting data spanning over enough time to allow the model to actually learn something from it are all crucial aspects of this process. The predictions will only be as good/relevant as the data on which the model was trained.
Once we have all available data, the next step is to engineer relevant features from it. This requires a good understanding of the business as well as technical expertise. Domain expertise is essential to pinpoint possible factors that could contribute to churn, which can then be framed as input features of the model.
After the input features are decided, the model can be trained on a subset of the available data (Training dataset) and then its performance evaluated against a test dataset. Multiple rounds of training may be done with different model parameters tweaked, in order to understand which model gives the best predictions on the test dataset. Here, model performance is measured based on several metrics, such as the overall accuracy of prediction, as also the AUC, Sensitivity, Specificity etc. the input features may also be changed (example, reducing/increasing features, combining features to create new ones) and the model metrics compared to understand the best performing model. Once we have the final model, new customer data can be fed into it to get predictions on the probability of churn. From the model output, it is also possible to understand which factors contribute the most to churn at a customer level.
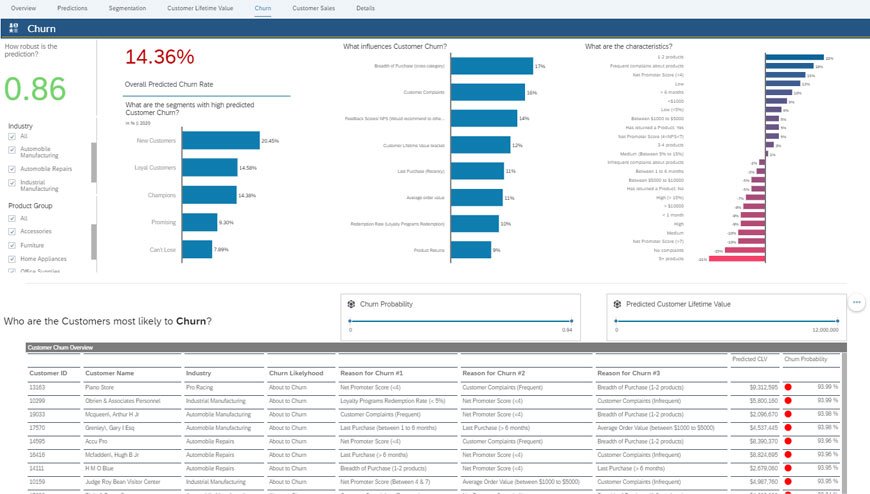
The picture below depicts a Churn dashboard. Each customer’s predicted churn risk can be viewed as also the main contributing factors towards that prediction.
All the approaches mentioned here make use of available customer data to gain better insights about the customer. Using a combination of these approaches will help us understand our customers better and provide them with a much better experience in the long run, helping us build a good customer relationship and retain a loyal customer base.


